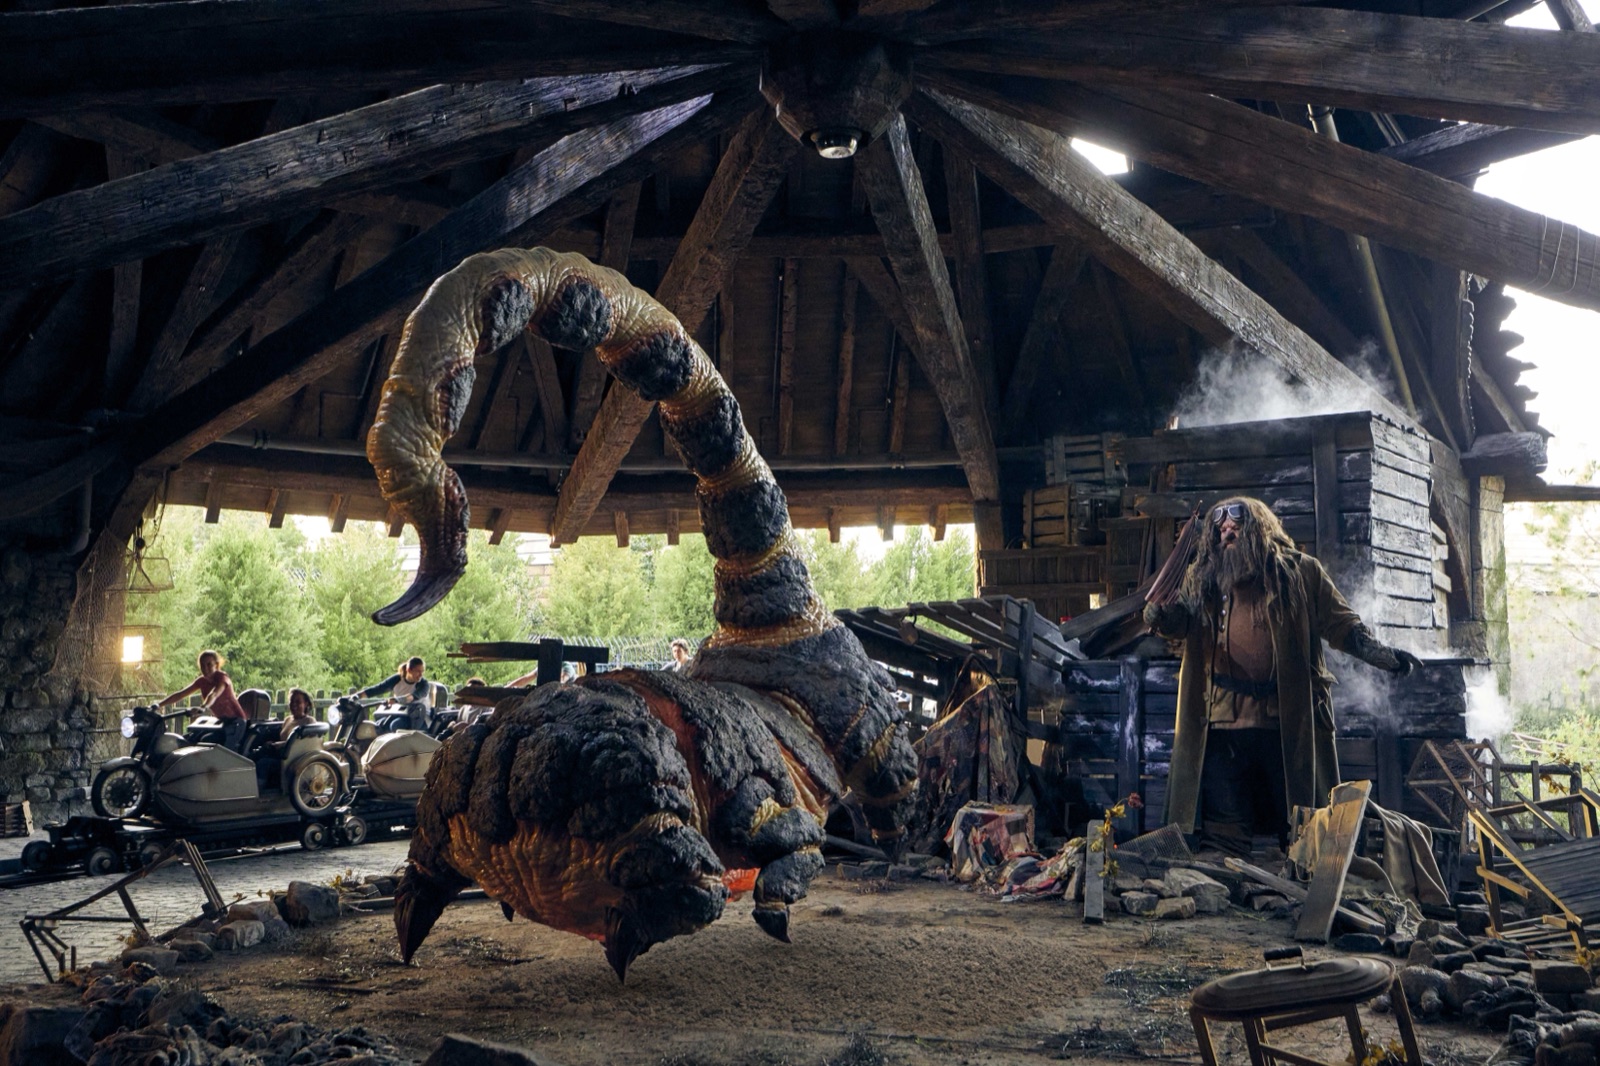
Four Universal Orlando attractions averaged more than one hour across their latest 90-day profiles. Mine-Cart Madness led at 103.5 minutes, followed by Harry Potter and the Battle at the Ministry at 88.2 and Hagrid's Magical Creatures Motorbike Adventure at 87.5.
The ranking covers 42 current attraction listings with positive operating standby averages and enough recent park-local history for comparison. Closed and down periods do not count as zero-minute waits. That keeps downtime from making an unreliable ride look artificially easy.
Universal Orlando wait-time rankings
The 10 longest average waits at Universal Orlando
| Rank | Attraction | 90-day average |
|---|---|---|
| 1 | Mine-Cart Madness | 103.5 min. |
| 2 | Battle at the Ministry | 88.2 min. |
| 3 | Hagrid's Motorbike Adventure | 87.5 min. |
| 4 | Mario Kart: Bowser's Challenge | 72.9 min. |
| 5 | Curse of the Werewolf | 44.5 min. |
| 6 | Jurassic World VelociCoaster | 44.2 min. |
| 7 | Escape from Gringotts | 36.3 min. |
| 8 | Hiccup's Wing Gliders | 35.6 min. |
| 9 | Yoshi's Adventure | 33.8 min. |
| 10 | Dudley Do-Right's Ripsaw Falls | 33.7 min. |
Epic Universe owns six spots in the top 10, including the two leaders. Islands of Adventure places three, and Escape from Gringotts is the lone Universal Studios Florida entry.
Epic Universe wait times ranked
Mine-Cart Madness had the resort's longest average and the lowest reliability score among Epic Universe's four one-hour attractions. Mario Kart carried the steadiest reliability of those four.
| Rank | Attraction | Average / reliability |
|---|---|---|
| 1 | Mine-Cart Madness | 103.5 min. / 78.5 |
| 2 | Battle at the Ministry | 88.2 min. / 92.2 |
| 3 | Mario Kart: Bowser's Challenge | 72.9 min. / 95.2 |
| 4 | Curse of the Werewolf | 44.5 min. / 87.9 |
| 5 | Hiccup's Wing Gliders | 35.6 min. / 85.3 |
| 6 | Yoshi's Adventure | 33.8 min. / 92.6 |
| 7 | Dragon Racer's Rally | 30.1 min. / 94.0 |
| 8 | Fyre Drill | 25.5 min. / 87.5 |
| 9 | Stardust Racers | 21.3 min. / 89.9 |
| 10 | Constellation Carousel | 17.6 min. / 96.6 |
| 11 | Monsters Unchained | 16.0 min. / 95.1 |
| 12 | Bowser Jr. Challenge | 7.8 min. / 99.8 |
Bowser Jr. Challenge is the cleanest low-wait backup in the park. Mine-Cart Madness is the opposite planning problem: the longest line paired with the park's lowest reliability score.
Islands of Adventure wait times ranked
Hagrid's averaged nearly twice as long as VelociCoaster. Pteranodon Flyers ranked fourth, but its 83.8 reliability score makes it a weaker fixed-time target.
| Rank | Attraction | Average / reliability |
|---|---|---|
| 1 | Hagrid's Motorbike Adventure | 87.5 min. / 86.8 |
| 2 | Jurassic World VelociCoaster | 44.2 min. / 88.2 |
| 3 | Dudley Do-Right's Ripsaw Falls | 33.7 min. / 88.7 |
| 4 | Pteranodon Flyers | 32.4 min. / 83.8 |
| 5 | Flight of the Hippogriff | 26.3 min. / 91.5 |
| 6 | The Amazing Adventures of Spider-Man | 25.7 min. / 97.2 |
| 7 | The Incredible Hulk Coaster | 23.0 min. / 90.2 |
| 8 | Hogwarts Express - Hogsmeade Station | 22.0 min. / 98.5 |
| 9 | Skull Island: Reign of Kong | 19.6 min. / 91.3 |
| 10 | Harry Potter and the Forbidden Journey | 19.5 min. / 95.9 |
| 11 | Popeye & Bluto's Bilge-Rat Barges | 15.7 min. / 87.6 |
| 12 | Doctor Doom's Fearfall | 15.3 min. / 91.8 |
| 13 | High in the Sky Seuss Trolley Train Ride | 13.7 min. / 90.4 |
| 14 | One Fish, Two Fish, Red Fish, Blue Fish | 10.4 min. / 93.2 |
| 15 | The Cat in the Hat | 8.2 min. / 96.1 |
| 16 | Caro-Seuss-el | 5.9 min. / 97.8 |
| 17 | Storm Force Accelatron | 5.7 min. / 98.7 |
Storm Force Accelatron paired the park's shortest listed average with its strongest reliability score. Jurassic Park River Adventure had only two valid dates after its recent return, so it stays outside this ranking until its 90-day profile has a useful comparison base.
Universal Studios Florida wait times ranked
Escape from Gringotts led this park by 5.9 minutes over Revenge of the Mummy. The Simpsons Ride had a perfect 100.0 reliability score in its profile, though the line still averaged 26.2 minutes.
| Rank | Attraction | Average / reliability |
|---|---|---|
| 1 | Escape from Gringotts | 36.3 min. / 94.5 |
| 2 | Revenge of the Mummy | 30.5 min. / 98.2 |
| 3 | Despicable Me Minion Mayhem | 28.6 min. / 98.7 |
| 4 | The Simpsons Ride | 26.2 min. / 100.0 |
| 5 | TRANSFORMERS: The Ride-3D | 23.6 min. / 96.3 |
| 6 | E.T. Adventure | 23.4 min. / 97.0 |
| 7 | Hogwarts Express - King's Cross Station | 23.2 min. / 98.5 |
| 8 | Race Through New York Starring Jimmy Fallon | 17.4 min. / 98.0 |
| 9 | MEN IN BLACK Alien Attack | 17.2 min. / 94.3 |
| 10 | Fast & Furious - Supercharged | 12.8 min. / 97.8 |
| 11 | Trolls Trollercoaster | 11.8 min. / 88.3 |
| 12 | Kang & Kodos' Twirl 'n' Hurl | 10.7 min. / 92.2 |
| 13 | Villain-Con Minion Blast | 6.4 min. / 99.2 |
Villain-Con is the park's easiest short-wait fallback. The two provider records labeled First Train and Last Train are not separate guest attractions, so the ranking uses the standard King's Cross Station listing.
How to use the longest-wait ranking
- Protect the top four first. Mine-Cart Madness, Battle at the Ministry, Hagrid's and Mario Kart are the only attractions above one hour.
- Pair pressure with reliability. Mine-Cart Madness and Hagrid's need flexible backups. Mario Kart's line is long, but its stronger reliability makes a timed plan less fragile.
- Use the park tables alongside the resort top 10. Gringotts matters at Universal Studios Florida even though six Epic Universe attractions rank above it resortwide.
- Check current conditions. A 90-day average is a recent baseline. Today's hours, weather and ride status can move the actual line sharply.
How CrowdLevels calculated the rankings
The ranking uses the latest 90-day profiles generated August 2, 2026, for current Universal Orlando attraction listings with positive operating standby averages and enough recent park-local history for a useful comparison. Volcano Bay is outside the scope because its slide and return-time operations are not directly comparable with standby ride queues in the three dry parks.
Each operating standby value contributes to its attraction average. Closed and down periods do not count as zero-minute waits. The reliability score describes how often the attraction was operating during valid park-hour checks. Planned closure periods are not treated as ordinary downtime.
Universal Orlando wait-time questions
Which Universal Orlando attraction has the longest average wait?
Mine-Cart Madness led the August 2 profiles at 103.5 minutes. Battle at the Ministry followed at 88.2 minutes.
Which Universal Orlando rides average more than one hour?
Mine-Cart Madness, Battle at the Ministry, Hagrid's Motorbike Adventure and Mario Kart averaged more than 60 minutes.
Which Universal Orlando park has the longest waits?
Epic Universe placed six attractions in the resortwide top 10. Islands of Adventure placed three, and Universal Studios Florida placed one.
Do closed rides count as zero-minute waits?
No. The ranking uses operating standby data, so closures do not pull an attraction's average down.
Sources
- Universal Orlando park guides for Epic Universe, Islands of Adventure and Universal Studios Florida
- Hagrid's Magical Creatures Motorbike Adventure official attraction and image page
- CrowdLevels 90-day attraction summaries and current park indexes for Epic Universe, Islands of Adventure and Universal Studios Florida, generated August 2, 2026
Related CrowdLevels guides
Image: Universal Orlando Resort. CrowdLevels data was generated August 2, 2026, from public attraction summary and current park endpoints.