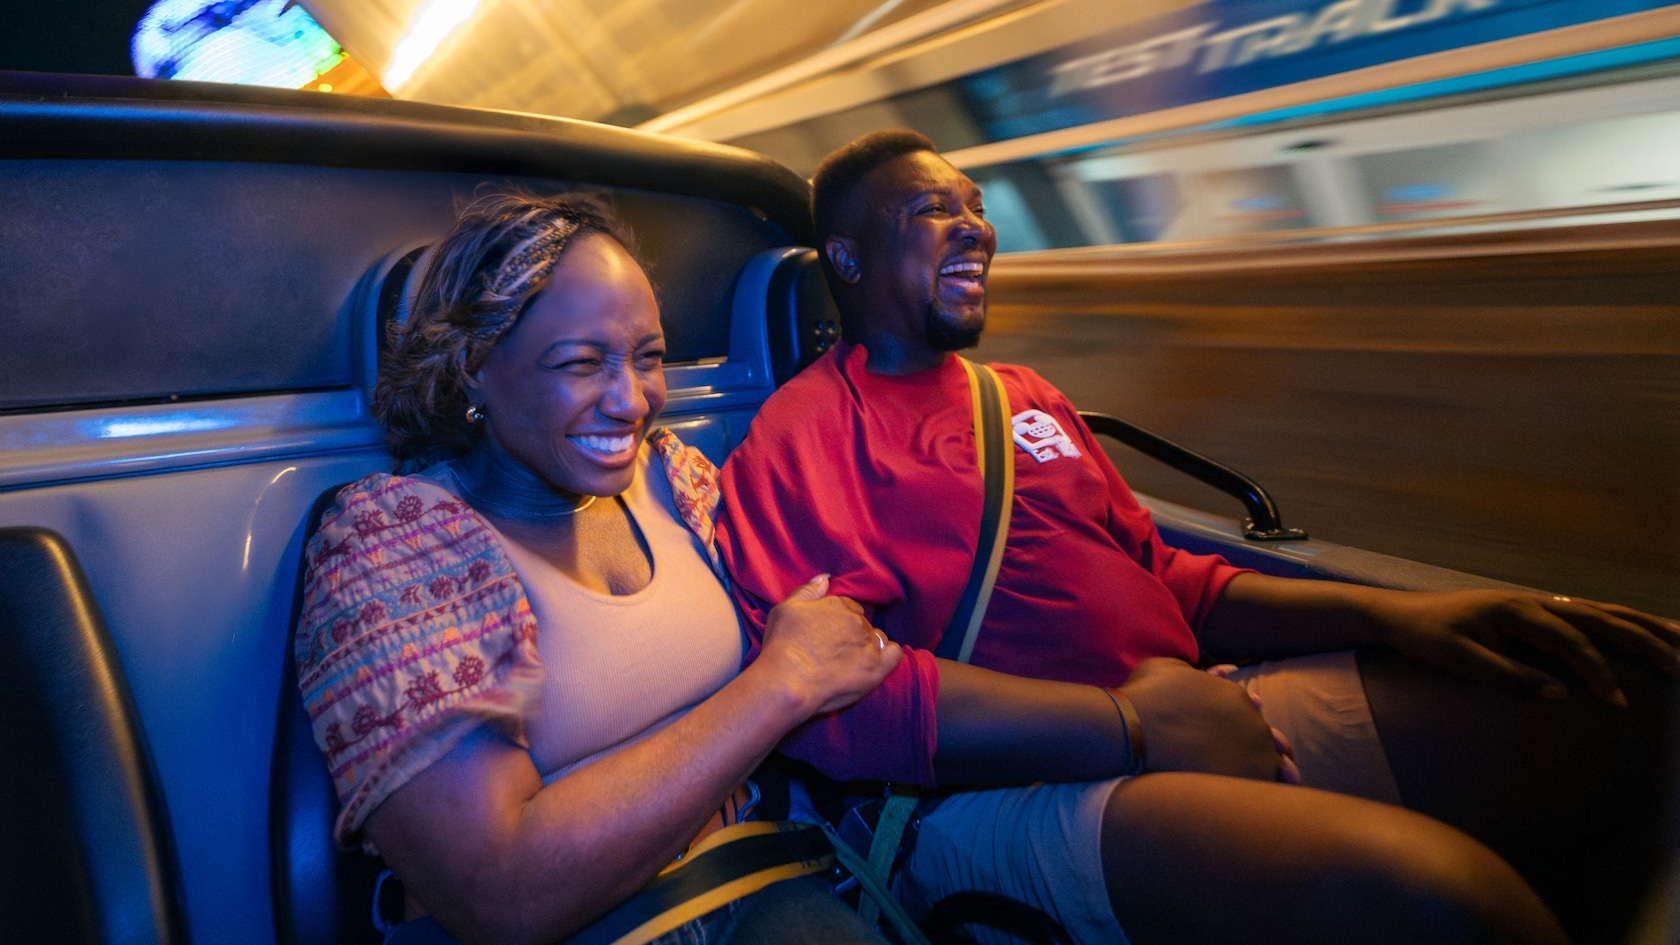
Five Walt Disney World attraction series averaged more than one hour across their latest 90-day profiles. Guardians of the Galaxy: Cosmic Rewind led at 76.4 minutes, followed by Test Track at 72.4 and TRON Lightcycle / Run at 64.7.
The ranking uses 571,835 operating standby observations across 52 tracked attraction series. Closed and down observations do not count as zero-minute waits. That keeps downtime from making a frequently unavailable ride look artificially easy.
Disney World wait-time rankings
The 10 longest average waits at Disney World
| Rank | Attraction | 90-day average |
|---|---|---|
| 1 | Guardians of the Galaxy: Cosmic Rewind | 76.4 min. |
| 2 | Test Track | 72.4 min. |
| 3 | TRON Lightcycle / Run | 64.7 min. |
| 4 | Rock ’n’ Roller Coaster Starring The Muppets | 64.2 min. |
| 5 | Slinky Dog Dash | 62.1 min. |
| 6 | Avatar Flight of Passage | 58.6 min. |
| 7 | Frozen Ever After | 50.5 min. |
| 8 | Star Wars: Rise of the Resistance | 48.1 min. |
| 9 | Seven Dwarfs Mine Train | 47.2 min. |
| 10 | Remy’s Ratatouille Adventure | 47.1 min. |
EPCOT, Hollywood Studios and Magic Kingdom each placed three attractions in the top 10. Animal Kingdom placed Flight of Passage at No. 6. The gap between Guardians and Remy was 29.3 minutes.
Magic Kingdom wait times ranked
TRON led the park at 64.7 minutes. Seven Dwarfs Mine Train followed at 47.2. Peter Pan’s Flight was the highest any-height ride at 39.1 minutes.
| Rank | Attraction | Average / reliability |
|---|---|---|
| 1 | TRON Lightcycle / Run | 64.7 min. / 97.1 |
| 2 | Seven Dwarfs Mine Train | 47.2 min. / 90.7 |
| 3 | Tiana’s Bayou Adventure | 40.7 min. / 90.6 |
| 4 | Peter Pan’s Flight | 39.1 min. / 98.6 |
| 5 | Big Thunder Mountain Railroad | 37.6 min. / 89.1 |
| 6 | Buzz Lightyear’s Space Ranger Spin | 34.5 min. / 97.4 |
| 7 | Space Mountain | 34.3 min. / 91.9 |
| 8 | Jungle Cruise | 33.2 min. / 95.1 |
| 9 | The Many Adventures of Winnie the Pooh | 29.9 min. / 91.3 |
| 10 | Haunted Mansion | 22.6 min. / 92.6 |
| 11 | Walt Disney World Railroad – Fantasyland | 17.5 min. / 92.4 |
| 12 | Walt Disney World Railroad – Main Street, U.S.A. | 17.3 min. / 92.5 |
| 13 | Pirates of the Caribbean | 16.8 min. / 95.3 |
| 14 | Astro Orbiter | 14.7 min. / 95.7 |
| 15 | Under the Sea – Journey of The Little Mermaid | 13.3 min. / 97.3 |
| 16 | Tomorrowland Speedway | 13.1 min. / 96.7 |
| 17 | The Barnstormer | 11.8 min. / 93.8 |
| 18 | “it’s a small world” | 11.0 min. / 96.6 |
| 19 | Dumbo the Flying Elephant | 10.8 min. / 96.4 |
| 20 | The Magic Carpets of Aladdin | 10.5 min. / 95.9 |
| 21 | Tomorrowland Transit Authority PeopleMover | 8.8 min. / 96.3 |
| 22 | Mad Tea Party | 8.5 min. / 99.0 |
| 23 | Prince Charming Regal Carrousel | 6.9 min. / 94.6 |
Mad Tea Party is the cleanest low-wait backup in the park: an 8.5-minute average with a 99.0 reliability score. Peter Pan is the opposite planning problem. Its average is high, but its 98.6 reliability score makes it less likely to erase a carefully timed return.
EPCOT wait times ranked
Guardians and Test Track held the two highest averages anywhere at Walt Disney World. Frozen and Remy also finished above 47 minutes.
| Rank | Attraction | Average / reliability |
|---|---|---|
| 1 | Guardians of the Galaxy: Cosmic Rewind | 76.4 min. / 97.1 |
| 2 | Test Track | 72.4 min. / 83.9 |
| 3 | Frozen Ever After | 50.5 min. / 92.2 |
| 4 | Remy’s Ratatouille Adventure | 47.1 min. / 92.7 |
| 5 | Soarin’ Across America | 33.1 min. / 99.8 |
| 6 | Mission: SPACE | 16.1 min. / 99.5 |
| 7 | Spaceship Earth | 13.3 min. / 93.0 |
| 8 | Living with the Land | 12.3 min. / 97.8 |
| 9 | The Seas with Nemo & Friends | 11.5 min. / 97.5 |
| 10 | Journey Into Imagination With Figment | 10.3 min. / 96.4 |
| 11 | Gran Fiesta Tour Starring The Three Caballeros | 6.8 min. / 98.4 |
Test Track combines a 72.4-minute average with the lowest reliability score in the 52-series set at 83.9. Gran Fiesta Tour is the easiest low-wait fallback at 6.8 minutes and 98.4 reliability.
Hollywood Studios wait times ranked
The Muppets coaster and Slinky Dog Dash both averaged more than one hour. Rise of the Resistance ranked fourth in the park at 48.1 minutes.
| Rank | Attraction | Average / reliability |
|---|---|---|
| 1 | Rock ’n’ Roller Coaster Starring The Muppets | 64.2 min. / 92.6 |
| 2 | Slinky Dog Dash | 62.1 min. / 88.9 |
| 3 | Star Wars: Rise of the Resistance | 48.1 min. / 90.5 |
| 4 | Toy Story Mania! | 38.8 min. / 97.8 |
| 5 | The Twilight Zone Tower of Terror | 38.0 min. / 98.8 |
| 6 | Mickey & Minnie’s Runaway Railway | 37.7 min. / 92.7 |
| 7 | Millennium Falcon: Smugglers Run | 31.4 min. / 99.6 |
| 8 | Alien Swirling Saucers | 23.3 min. / 99.7 |
| 9 | Star Tours – The Adventures Continue | 6.9 min. / 99.8 |
Star Tours is the strongest pressure-release choice in the park. Its 6.9-minute average is less than one-ninth of the Muppets coaster average, and it carried a 99.8 reliability score.
Animal Kingdom wait times ranked
Flight of Passage stood alone at 58.6 minutes. Na’vi River Journey followed at 38.6, while the remaining tracked series stayed below 35 minutes.
| Rank | Attraction | Average / reliability |
|---|---|---|
| 1 | Avatar Flight of Passage | 58.6 min. / 98.7 |
| 2 | Na’vi River Journey | 38.6 min. / 97.6 |
| 3 | Kali River Rapids | 34.1 min. / 89.4 |
| 4 | Kilimanjaro Safaris | 25.9 min. / 99.8 |
| 5 | Expedition Everest | 25.9 min. / 89.2 |
| 6 | Zootopia: Better Zoogether! | 11.8 min. / 97.7 |
| 7 | Wildlife Express Train | 8.7 min. / 98.6 |
| 8 | Gorilla Falls Exploration Trail | 4.5 min. / 96.4 |
| 9 | Maharajah Jungle Trek | 4.4 min. / 96.4 |
Kilimanjaro Safaris and Expedition Everest tied at 25.9 minutes, but their reliability scores were far apart: 99.8 for the safari and 89.2 for Everest. The trail rows represent posted attraction waits, not conventional ride queues.
How to use the longest-wait ranking
- Protect the top two priorities. Use the best-time-of-day guide to place the rides that matter most at opening or late in the day.
- Pair pressure with reliability. A long, reliable line is easier to schedule than a long line attached to frequent downtime. Test Track, Slinky Dog Dash and Expedition Everest need flexible backups.
- Keep one low-wait alternative nearby. Mad Tea Party, Gran Fiesta Tour, Star Tours and the Wildlife Express Train each averaged less than nine minutes.
- Check the live park page. A 90-day average describes the recent baseline. Today's weather, park hours and ride status can move the actual line sharply.
How CrowdLevels calculated the rankings
The ranking uses the latest 90-day profiles generated July 27, 2026, for 52 attraction series with posted standby values and matching CrowdLevels attraction pages. The combined set contains 571,835 operating wait observations.
Every recorded operating standby value contributes to its attraction average. Closed and down observations do not count as zero-minute waits. The reliability score describes how often the attraction was operating when CrowdLevels collected valid park-hour observations. Planned closure periods are not treated as ordinary downtime.
The list includes two Walt Disney World Railroad stations and three Animal Kingdom walk-through or transport experiences because they carry posted attraction waits in the data. It does not claim that every row is a conventional ride queue. Averages are rounded to one decimal and can change as the rolling window advances.
Disney World wait-time questions
Which Disney World attraction has the longest average wait?
Guardians of the Galaxy: Cosmic Rewind led the July 27 profiles at 76.4 minutes. Test Track followed at 72.4 minutes.
How many Disney World attractions average more than one hour?
Five series averaged more than 60 minutes: Guardians, Test Track, TRON, the Muppets coaster and Slinky Dog Dash.
Which Disney World park has the most long waits?
EPCOT, Hollywood Studios and Magic Kingdom each placed three attractions in the overall top 10. Animal Kingdom placed Flight of Passage.
Do closed rides count as zero-minute waits?
No. The ranking uses operating standby observations, so closures do not pull an attraction’s average down.
Sources
- Walt Disney World rides and attractions
- CrowdLevels 90-day attraction summaries and current park indexes generated July 27, 2026, for Magic Kingdom, EPCOT, Hollywood Studios and Animal Kingdom
Related CrowdLevels guides
Image: Walt Disney World Resort. CrowdLevels data was generated July 27, 2026, from public attraction summary and current park endpoints.